

EPA Green Infrastructure Modeling Tools This page includes everything from an overview of basic modeling principles to cost and performance spreadsheets to complex SWMM modeling and i-Tree applications.
Naturally Resilient Communities Interactive Tool Guide to nature-based solutions to urban hazards with case studies by region, challenge, and solution. Developed by the Nature Conservancy, in partnership with the American Planning Association, American Society of Civil Engineers, National Association of Counties, and the Association of State Floodplain Managers
Earth Economics Benefit Valuation Tool Earth Economics is developing a tool, that will be available online and will allow users to estimate costs and benefits of green infrastructure installations. The tool will estimate a variety of green infrastructure benefits, including flood prevention, property value uplift, and groundwater recharge based on localized conditions and regional demographic characteristics.
CALCULATING COSTS + PERFORMANCE
International Stormwater Best Management Practices Database
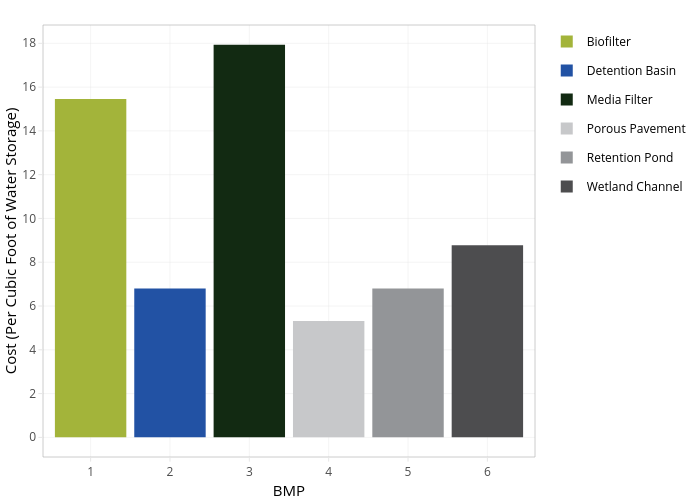
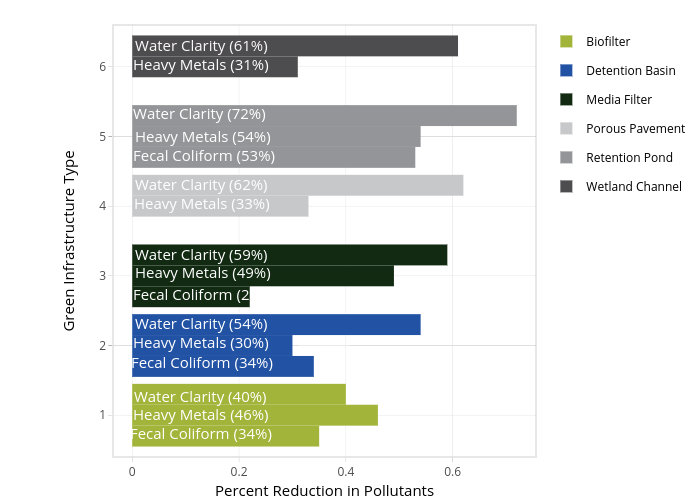
A collaboration between the American Society of Civil Engineers and the US EPA, the BMP Database is an online global repository of academic and scientific research on green infrastructure installations. The database houses more than 30,000 values on water quality and water capture performance of green infrastructure. The cost and performance levels of individual green infrastructure assets have been monitored and studied extensively over the past decade. While on-the-ground realities will certainly fluctuate by municipality, the data and evidence are out there to reasonably inform planning decisions. The graphs and table below display some values calculated by Earth Economics from data in the database. Our analysis of the values in the BMP database demonstrates that green infrastructure installations significantly improve water quality, capture stormwater, and reduce peak flows, and that these assets compete with their grey counterparts on cost for both installation and maintenance.
Cost and Performance Values of GI Best Management Practices (click to enlarge)
VISUALIZE COSTS (click to enlarge)
VISUALIZE PERFORMANCE (click to enlarge)
Examples

La crosse, wisconsin
Flipped the burden of proof and officially reset their default to green. Any project that does not prioritize nature-based solutions must make an official case for why not and have their arguments against green infrastructure reviewed by a city council that has mandated its prioritization as a community asset. When integrated infrastructure is the default, reverting back to traditional capital planning becomes more work.

atlanta, georgia
The stormwater management team developed a simple checklist for their engineers that quickly and efficiently operationalized the consideration of green options on all projects. Checklists work.
Download Full Report | Contact Us
Reproduction of this publication for educational or other non-commercial purposes is authorized without prior written permission from the copyright holder provided the source is fully acknowledged. Reproduction of this publication for resale or other commercial purposes is prohibited without prior written permission of the copyright holder.
© Earth Economics 2018